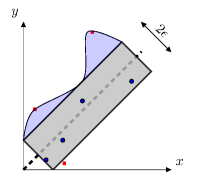
Sketch of support vector regression (SVR).
Data point inside (blue bullet) and outside (red square)
the tube (gray area). The gray dashed line is the hyperplane (regression plane)
predicted by (the non-linear) svrLinear. A large C enlarges the area of the tube (blue area)
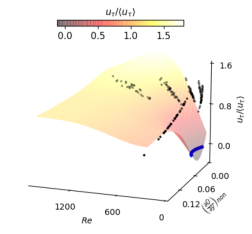
Colored surface is the hypersurface (instead of hyperplane since it is non-liner).
In my Report I get non-physical (negative) friction velocities
predicted by svrLinear when I use too small
"slack" (i.e. too large C). Thick blue line: uτ=0
Developing turbulence models using Machine Learning in Python
Department of Mechanics and Maritime Sciences Division of Fluid Dynamice |